
How to use the ABA data sheet generator
- Pick the sheet that matches what you need to measure: ABC for the context around a behavior, DTT for trial-by-trial teaching, frequency, duration or interval recording for how much a behavior happens, and task analysis for a chained skill.
- Fill in the header: the learner’s initials or a code, the observer, the date and the setting. Use initials or a code instead of a full name, and keep filled-in sheets with your other client records.
- Write the target behavior and its operational definition, or list your DTT targets or task analysis steps, one per line.
- Set the details: how many rows, trials or sessions, the interval length and recording method, checklist or narrative ABC, and Letter or A4 paper.
- Check the live preview. If the rows don’t fit on one page, the sheet continues on a second page with the table header repeated.
- Click Download PDF, or Print to open the sheet in your browser’s PDF viewer and send it straight to the printer.
Which ABA data sheet should you use?
The right ABA data sheet depends on the question you need answered. Use an ABC data sheet to find out why a behavior happens, a frequency, duration or interval recording sheet to measure how much it happens, a DTT sheet for discrete trial teaching and a task analysis sheet for a chained skill such as handwashing.
Pick the measurement before the sheet. The question you need answered decides what you record, and the sheet just makes that easy to do in the middle of a session.
- ABC data sheet: you want to know why a behavior happens. Record what came right before and right after each occurrence, as the first step toward a hypothesis about function.
- Behavior frequency data sheet: the behavior has a clear start and end and doesn’t last long, such as hitting, calling out or requests. Count it, and turn the count into a rate when sessions vary in length.
- Duration data sheet: how long the behavior lasts matters more than how often, such as tantrums, time on task or time out of seat.
- Interval recording data sheet: the behavior is too frequent or too continuous to count reliably, such as stereotypy or engagement. Partial interval tends to overestimate and whole interval to underestimate. Momentary time sampling only looks at the moment each interval ends, so it can over- or underestimate, depending on how the behavior is spread over the session and how long the intervals are.
- Discrete trial training data sheet: you teach in clear trials with an SD, a response and a consequence, and score each trial correct, incorrect or prompted.
- Task analysis data sheet: the skill is a chain of steps, such as handwashing or getting dressed, and you score the prompt level on each step.
How do you fill in an ABC data sheet?
An antecedent-behavior-consequence (ABC) data sheet gets one row per occurrence: the antecedent (what happened right before), the behavior (what the learner did, in observable terms) and the consequence (what happened right after), with the date and time. Fill in each row as soon as the behavior ends, and record what you saw, not what you think it meant.
Fill in a row as soon as the behavior is over, while the details are fresh. ABC data written at the end of the day turns into a summary, and summaries lose exactly the small details that point to function.
Write what you saw and heard, not what you think it meant. “Teacher said ‘clean up, it’s time for math’ and took the iPad” is useful. “He was frustrated” is not, because another observer can’t check it.
Use the checklist format once you know the usual antecedents and consequences for a learner. Ticking a box is faster than writing, so it is easier to keep up with a busy classroom, and the Other line catches anything new. Use the narrative format for a first look, when you don’t know yet what to list.
Collect several occurrences across different times, settings and people before drawing conclusions. ABC data suggests a pattern; it does not confirm function on its own.
How to write an operational definition
An operational definition describes a behavior in observable, measurable terms, so clearly that two people watching the same session would count the same thing. A good operational definition names what the behavior looks like, when an occurrence starts and ends, and gives examples and non-examples. It never describes why the behavior happens or how the learner feels.
- Describe observable actions: “strikes another person with an open or closed hand” instead of “aggressive”.
- Say when an occurrence starts and ends, especially for duration data: “starts when he leaves his chair, ends when he is seated again”.
- Add examples and non-examples, such as “high fives do not count”.
- Test it: if a new RBT reads it and records the same session as you, your numbers should match. That is what interobserver agreement checks, and the free IOA calculator works out the percentage for all nine methods.
How to score DTT and task analysis data
DTT data are scored per trial and task analysis data per step. Percent correct on a DTT sheet is the number of independent correct trials divided by the trials run, times 100. Percent independent on a task analysis sheet is the number of steps done without a prompt divided by the total steps, times 100.
On the discrete trial training data sheet, score each trial + for a correct independent response, - for an incorrect response, P with the prompt level for a prompted trial, and NR for no response. % correct for a target is the number of + trials divided by the trials you ran, times 100. Prompted trials don’t count as correct.
On the task analysis data sheet, write the prompt level each step needed: I for independent, G gestural, V verbal, M model, PP partial physical and FP full physical. % independent for a session is the number of steps scored I divided by the total number of steps, times 100. Mark the chaining method on the sheet so everyone teaching the skill runs it the same way.
DTT targets often come straight from a skills assessment. If you work from the VB-MAPP, the free VB-MAPP goal mapper turns a milestone area into practice goals you can paste into the target list.
Tips for ABA data collection on paper
Good ABA data collection on paper comes down to making the right thing easy in the moment: the operational definition printed on the sheet, the clipboard where the behavior happens, the same recording method every session, and the data graphed within the week so they inform a decision instead of sitting in a drawer.
Studying for the RBT? Data Collection and Graphing is one of the six domains on the exam, and these sheets are the ones its questions describe. The free RBT practice test lets you practice that domain on its own, with every answer explained.
- Use initials or a code instead of a full name, and keep filled-in sheets with your other client records, not on a table or in a car. Initials with a date and a setting can still point to one child.
- Print the operational definition on the sheet, so every observer works from the same words.
- Keep the clipboard where the behavior happens. A sheet across the room gets filled in from memory.
- Use the same interval length and recording method every session, or your data won’t be comparable from one day to the next.
- Graph the data the same week with the free ABA graph maker. A data sheet in a drawer doesn’t inform a decision.
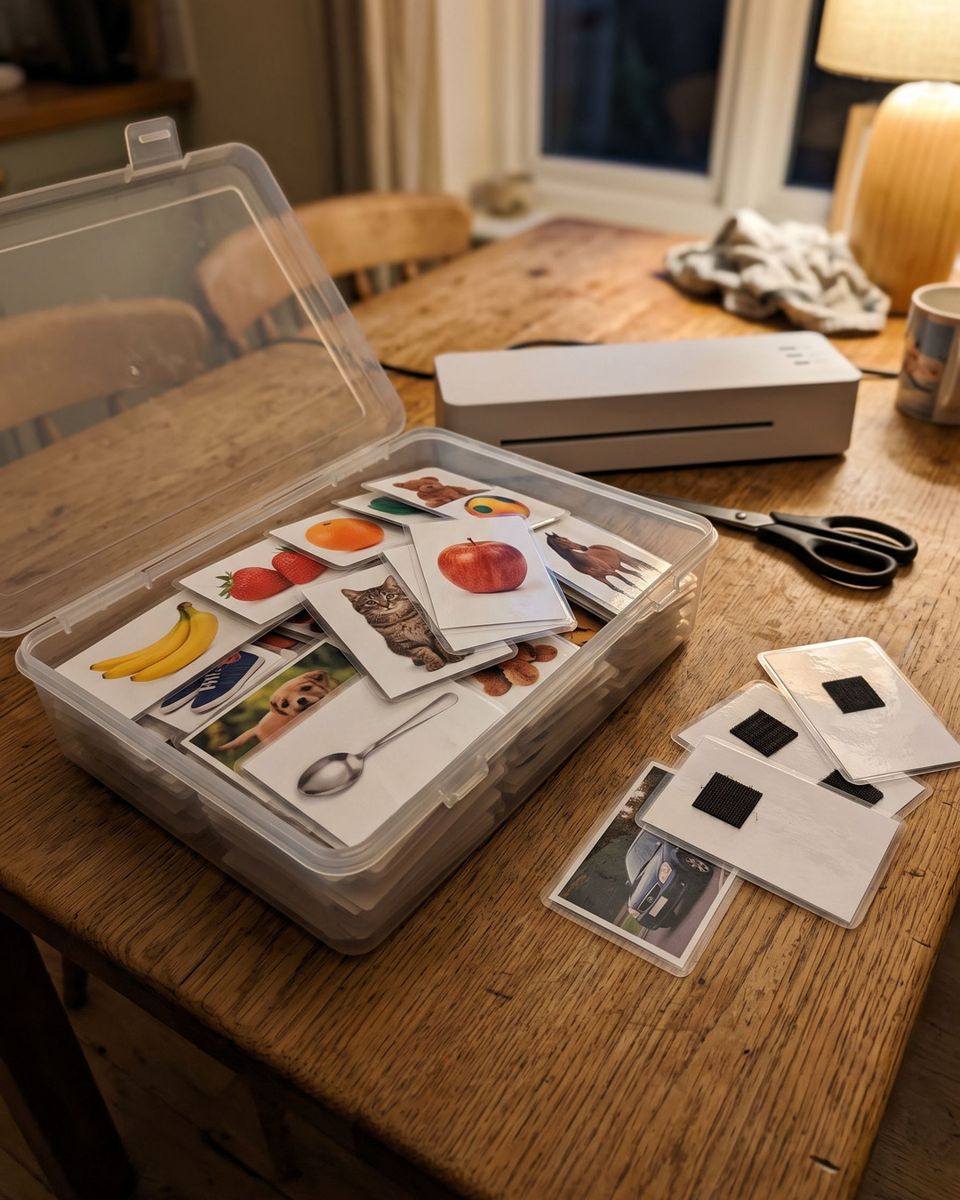
Free download1 ZIP · 94 packs
All 94 printable skill packs, free
Listening, matching, math, reading and more, one skill per pack, each with an adult guide, practice rounds and a log.
Cite this page
Citation (APA style)
SuperChild. (2026). Free ABA data sheets: ABC, DTT, frequency and more. Retrieved from https://superchild.ai/free-tools/aba-data-sheets
Link for your website
<a href="https://superchild.ai/free-tools/aba-data-sheets">Free ABA data sheets: ABC, DTT, frequency and more</a> (SuperChild)